
Why is the U.S. 30-year treasury yield nearing a 30-year high-and why should stock investors care?
Updated: Oct 28
When consumers need to borrow money, they take out loans from the bank, agreeing to pay back interest along with the borrowed principal. Though what happens when governments need to borrow a large financial capital, that too, for a long period of time? Undoubtedly, borrowing from the bank is an option, but what if a more flexible method exists that benefits both the government and taxpayers? Governments often issue treasury bonds to raise large funds for capital intensive projects, such as building a highway. A treasury bond is a simple financial agreement - you lend money to an entity, and in return, they pay you periodic interest, called the treasury yield, and promise to pay back your original loan on a set date in the future. The treasury yield is a financial incentive to purchase a bond – and thus is inversely proportional to the number of bonds issued.
At 5.3%, the treasury yield for the United States treasury has been increasing, almost double of what it was 10 years ago. The primary macro-economic force driving the yields upwards is a severe supply-demand imbalance caused by the expanding $1.97 trillion-dollar federal deficit. The volume of long-term bonds issued by the U.S. treasury must increase to fund continuous government spending, forcing the bond prices down while pushing the yield up to increase sufficient capital.
Furthermore, investors are primarily demanding greater compensation over the 30-year period due to the increasing inflation. Locking up capital for a 30-year period not only carries significant long-term hazards but reduces the “true-value” and purchasing power of money. Simply put – money tomorrow is worth less than money today and locking up a significant amount of capital for 30 years in return for money with a reduced worth is not financially attractive for investors
While macroeconomic shifts do clearly provide a reason for increasing bonds yields, a greater explanation can be found from a stock-market investor’s perspective. These investors primarily worry about long-term interest rates for they dictate a corporate cash flows present valuation. The Gordon Growth Model () creates a direct mathematical link between a stock’s fair intrinsic value (), or the true economic worth based on future cash generation - independent of its current market trading price, the investor’s required rate of return (), and the perpetual growth rate of dividends (), or the constant annual percentage at which a company's dividend payments are expected to increase forever into the future. The variable creating a direct link between bond yields and stock prices is (). Investors calculate this value using another finance formula called the Capital Asset Pricing Model (), which is represented as:


β is a measure of the volatility of the market
ERP , Equity Risk Premium is the baseline premium for the entire stock market
Serving as the baseline floor for risk-free long investments, is directly benchmarked against the U.S. treasury yield - whenever the long-term bond yields, spike, moves at once. Consequently, increases for every stock across the financial market. As a result, the value of the denominator of the increases. As a result, drops drastically!
Beyond complex mathematical formulae, rising 30-year yields create a real world drag on corporate balance sheets by elevating borrowing costs across the economy, directly consuming corporate cash flows and profit margins. As a result, companies scale research, development, and expansion, resulting in a decrease in the dividend growth rate , which only accelerates a declining stock price.
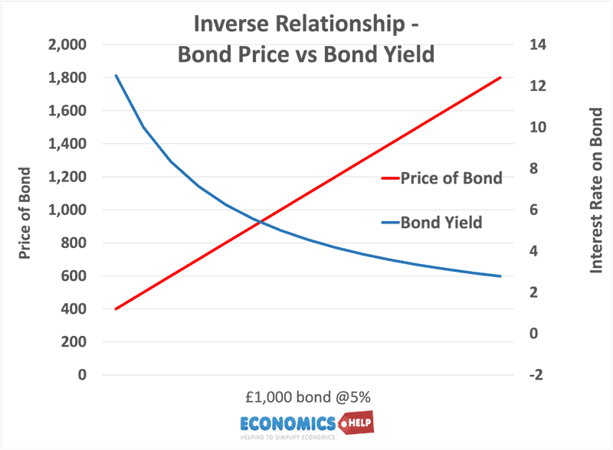
To conclude, the massive federal debt issuance, expanding term premiums, and inflation are contributing to a multi-decade high in Treasury yields. Investors, primarily stock investors, are concerned due to a decreasing stock market valuations dictated by the framework of the . Understanding this financial landscape is crucial to connect two seemingly unrelated topics into a cohesive economic picture.
References :
Berk, Jonathan, and Peter DeMarzo. Corporate Finance. 5th ed., Pearson, 2020.
Damodaran, Aswath. Equity Risk Premiums (ERP): Determinants, Estimation, and Implications – The 2024 Edition. NYU Stern School of Business, 2024.
Damodaran, Aswath. Investment Valuation: Tools and Techniques for Determining the Value of Any Asset. 3rd ed., John Wiley & Sons, 2012.
Gordon, Myron J. The Investment, Financing, and Valuation of the Corporation. Richard D. Irwin, 1962.
Sharpe, William F. “Capital Asset Prices: A Theory of Market Equilibrium under Conditions of Risk.” The Journal of Finance, vol. 19, no. 3, 1964, pp. 425–442.
United States, Congressional Budget Office. The Budget and Economic Outlook: 2024 to 2034. CBO, 2024–2026.
United States, Department of the Treasury. “Daily Treasury Par Yield Curve Rates.” U.S. Department of the Treasury, 2025–2026, www.treasury.gov.
United States, Department of the Treasury, Bureau of the Fiscal Service. “Fiscal Data.” Fiscal Data, 2026, fiscaldata.treasury.gov.


Comments